AI visibility is the share of AI answers to your buyers' questions that name your brand. To measure it, ask the same buying questions to each AI engine many times, then count how often you are named, where you sit in the list, how you are described and which websites the answers cite.
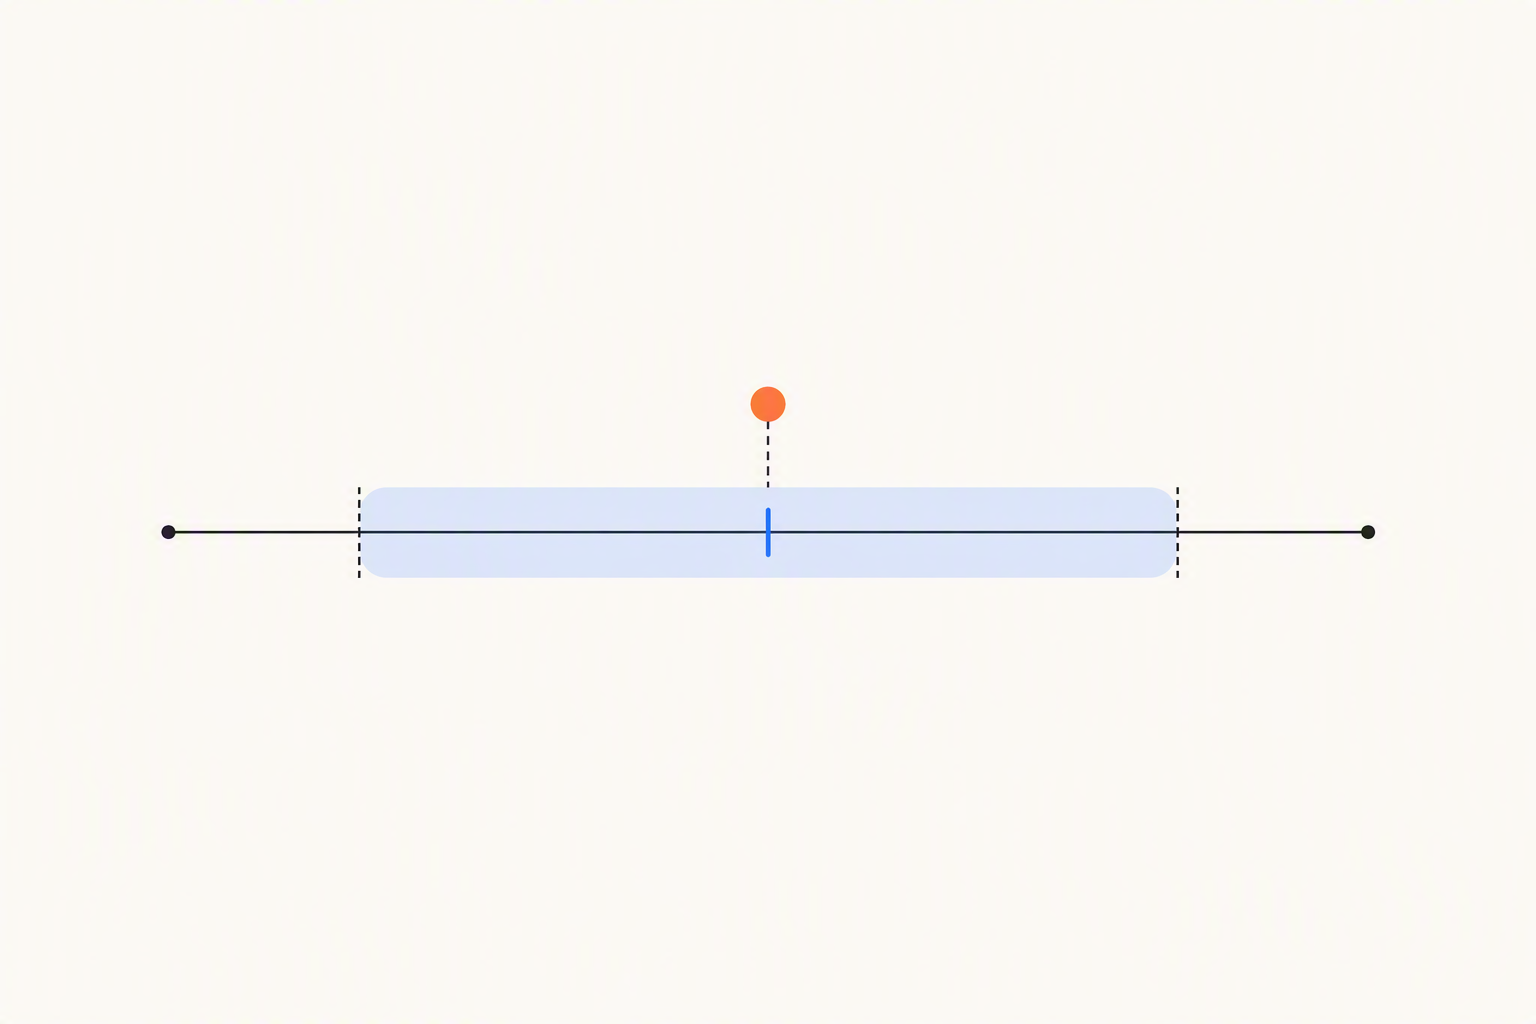
One answer tells you very little, because AI engines change their answers from run to run. If 28 of 45 answers name you, your visibility is 62%, and the true rate most likely sits anywhere from 48% to 75%.
What is AI visibility?
AI visibility, also called AI search visibility, is how often AI assistants mention your brand when people ask them questions in your category. Each question you send to an AI engine is called a prompt. The main engines are ChatGPT, Gemini, Perplexity and Google AI Overviews. An AI Overview is the AI-written summary Google shows above some search results.
It differs from a Google ranking in three ways:
- An AI answer has no fixed position 1, and its length and order change between runs.
- The same question can name different brands minutes apart.
- Each engine picks its sources in its own way, so a strong result on one engine predicts little about the next.
So measure AI visibility as a rate across many answers.
Why can't one AI answer measure your visibility?
Three public studies show how much answers move:
- SparkToro and Gumshoe had 600 volunteers run 12 prompts through ChatGPT, Claude and Google's AI tools 2,961 times in November and December 2025. The same list of brands came back less than 1% of the time. The same list in the same order came back about once in 1,000 runs.
- SISTRIX tracked 82,619 prompts for 17 weeks, from December 2025 to April 2026. In Germany, 74% of the sources ChatGPT cited were new from one week to the next. In the UK the figure was 60%.
- Kevin Indig's analysis of Omnia data covered 3.7 million citations from 20,000 prompts. Only 2.37% of cited URLs appeared in all three of ChatGPT, Perplexity and Google AI Overviews for the same prompt. 91% appeared in just one engine.
So one screenshot proves nothing in either direction. SparkToro also found that how often a brand appears across many runs is more consistent than the order it appears in.
How is AI visibility measured?
Write each prompt the way a buyer would type it. Pick 20 to 50 buying prompts, ask each one on every engine you care about, and repeat on a schedule. Leave out questions that contain your brand name. A question like "is Brand X any good?" almost always returns Brand X and inflates the score.
From the stored answers, calculate four AI visibility metrics for each engine:
| Metric | What it answers | How to calculate it | How to read it |
|---|---|---|---|
| Visibility | How often does AI name us? | Answers that name you, divided by all answers | Always with the answer count and a range |
| Share of voice | Of all brand mentions, how many are ours? | Your mentions, divided by mentions of every tracked brand | Same competitors, same questions |
| Average position | When we are named, how early? | Mean order of first mention, where 1 is named first | Only next to visibility |
| Sentiment | How does AI describe us? | Positive, neutral or negative, with the quoted sentence | Watch the direction over weeks |
A worked example: 40 prompts asked 3 times each on ChatGPT give 120 answers. If 74 of them name you, your ChatGPT visibility is 62%.
Share of voice is your share of all brand mentions in your category's answers. Because it compares you with competitors in the same answers, a model update that moves every brand at once changes it less. AI share of voice explained covers the calculation in detail.
Read position only next to visibility. Being named first in 8% of answers is weaker than being named third in 55% of them.
Report every engine separately. A brand at 70% on Gemini and 10% on Perplexity averages 40%, the same as a brand at 40% everywhere, and the two need very different work. AEO vs GEO vs SEO explains why engines diverge.
Add one more input: cited sources, the websites an answer links to. Ahrefs studied 75,000 brands and found that branded web mentions correlated with brand mentions in Google AI Overviews at 0.664, against 0.218 for backlinks. The link is a correlation and does not prove cause. It still makes the sites an engine keeps citing a practical list of places to get mentioned.
How many answers do you need?
Every visibility number needs two companions. The first is the number of answers behind it, which statisticians write as n. The second is a 95% confidence range: the band the true rate most likely sits in. We calculate ranges with the Wilson score interval, a standard formula for a percentage that stays accurate near 0% and 100%.
Go back to the example at the top: 28 answers that name you out of 45. Visibility is 62%, and the 95% range runs from about 48% to 75%. If next month reads 68%, that sits inside the same band, so nothing has changed that you can detect. At the same 62% rate, 140 answers narrow the range to about 54% to 70%.
Here is how the range shrinks at 50% visibility:
| Answers behind the number | 95% range |
|---|---|
| 20 | 30% to 70% |
| 80 | 39% to 61% |
| 400 | 45% to 55% |
| 1,000 | 47% to 53% |
Two rules follow. Publish the range with the number: "62% of 45 answers, range 48% to 75%" can be checked, and "62%" cannot. Count a move as real only when the new range does not overlap the old one. For how much a single question's answers vary, read whether ChatGPT gives the same answer to everyone.
What do 480 AI answers from India show?
The English vs Hinglish AI shopping study asked 10 buying prompts, 5 in skincare and 5 in fashion, in English and in Hinglish, 8 times each, to ChatGPT, Gemini and Perplexity from inside India. Fieldwork ran on 14 August 2026 and produced 480 answers: 80 per engine in each language. Hinglish is Hindi and English typed in English letters, the way many Indian buyers write ("sabse accha protein powder kaunsa hai").
Some gaps are real and some are noise. We put 95% ranges on four brand rates from the study:
| Engine and brand | English | Hinglish | Ranges overlap? |
|---|---|---|---|
| Perplexity, The Derma Co | 2.5% (2 of 80), range 1% to 9% | 20.0% (16 of 80), range 13% to 30% | No, a clear difference |
| Perplexity, Taneira | 15.0% (12 of 80), range 9% to 24% | 0.0% (0 of 80), range 0% to 5% | No, a clear difference |
| Gemini, Minimalist | 45.0% (36 of 80), range 35% to 56% | 36.3% (29 of 80), range 27% to 47% | Yes, too close to call |
| ChatGPT, Minimalist | 36.3% (29 of 80), range 27% to 47% | 42.5% (34 of 80), range 32% to 53% | Yes, too close to call |
An 8.7-point drop for Minimalist on Gemini sounds like news. At 80 answers per language, it sits inside normal variation. The Derma Co's 17.5-point rise on Perplexity clears it.
Citations change with language. Gemini attached at least one source to 90.0% of English answers (72 of 80) and to 41.3% of Hinglish answers (33 of 80).
Method and limits. Brand rates and citation counts come from the study's published results. We calculated the Wilson ranges on 15 September 2026 from the published counts. Each brand rate is out of all 80 answers for that engine and language, including prompts from the other category. The study covers 10 prompts in 2 categories, one fieldwork day and one urban Hinglish register. ChatGPT and Gemini answers were captured from their consumer web apps without a signed-in account, and Perplexity answers came from the answer model Perplexity sells through its API, with live web search, so signed-in users may see different answers. Depra funded and ran the study and sells AI visibility tracking. The raw answers, code and prompts are public on GitHub so anyone can recheck them.
Why measure English and Hinglish separately?
Prompt language changes which brands some engines recommend. In the same study, the brand list changed between English and Hinglish by more than normal rerun noise: 2.2 points on ChatGPT, 7.8 on Gemini and 23.4 on Perplexity.
If you blend both languages into one number, a brand that gains in Hinglish and loses in English can look flat. Track English and Hinglish as separate prompt sets with separate scores, and write each Hinglish prompt so it asks exactly what its English pair asks. Hinglish AI visibility tracking shows how the split appears in a report.
How to track AI visibility over time
- Freeze the prompt set. Editing wording mid-quarter resets your baseline. Add new prompts as a separate group and compare them from their start date.
- Repeat on a schedule. Daily where you can, weekly at minimum.
- Use a rolling window. Compare the last 7 or 28 days with the period before, so single-day swings average out.
- Compare ranges. Count a change only when the two periods' ranges do not overlap.
- Note model release dates. A step change on the day an engine ships a new model may be the engine changing, with nothing to do with your content.
- Track competitors on the same questions. Your share of voice against the same brands tells you more than your rate alone.
A spreadsheet handles one engine and about 20 questions. Tracking brand mentions in AI answers walks through that setup.
Depra asks each prompt to ChatGPT with web search, Gemini and Google AI Overviews every day, and to Perplexity every week, from inside the country you pick. It stores every full answer and compares each score with the previous period. The daily brief, a page inside the app, flags a change only when it is bigger than normal run-to-run noise. See AI visibility tracking in Depra and the full rules in Depra's scoring rules.
How can I check my AI visibility for free?
You can run a rough check by hand:
- Write 10 buying questions a customer would ask, with no brand names in them.
- Open ChatGPT, Gemini and Perplexity in a private browser window, signed out where the engine allows it.
- Ask each question 3 times on each engine, starting a new chat every time.
- Search Google for the same questions and note whether an AI Overview appears and whether it names you.
- Log every answer in a spreadsheet: date, engine, question, run, brands named in order, the sentence about you, and the links cited.
- For each engine, divide the answers that name you by all answers.
That gives 30 answers per chat engine. At 50% visibility, 30 answers carry a range of about 33% to 67%, which is fine as a baseline and too wide to spot a month-to-month change. Your location and browser can also change what you see.
Depra has no free plan. Every plan offers a 7-day trial; a card is required to start the trial. Starter costs ₹1,999 a month plus GST and includes 16 prompt slots in one project. Check the current pricing page for plan limits and terms. Read how Depra's AI visibility check works or compare plans on the pricing page.
What should an AI visibility report include?
A useful AI visibility report answers "are we showing up, against whom, and what do we fix next" with numbers a reader can check:
- A one-line summary: visibility, the number of answers behind it, and your rank among tracked brands.
- Visibility for each engine, with its confidence range.
- Share of voice and average position against the same competitors.
- Sentiment, with the sentences AI used about you.
- The websites answers cite, including sites that name your competitors and never you.
- English and Hinglish side by side, if you sell in India.
- Change against the previous period, marked only when it clears normal noise.
- The 3 to 5 fixes to work on next.
When you compare tools, check that each one shows answer counts and ranges, reports engines separately, runs competitors on identical prompts and leaves out questions that name your brand.
Depra's report is one printable page per project with a plain-English summary, visibility by engine with ranges, an English vs Hinglish table, competitors and your top fixes. Agencies can add their own logo, accent colour and footer, then save it as a PDF from the browser. Depra for agencies covers client reporting.
Start 7 days free on any plan. A card is required for the trial. Add buying questions and competitors to build your monitoring set.
For a practical next step, read how to choose AI visibility prompts and how to build a useful AI visibility report.